

Wheat
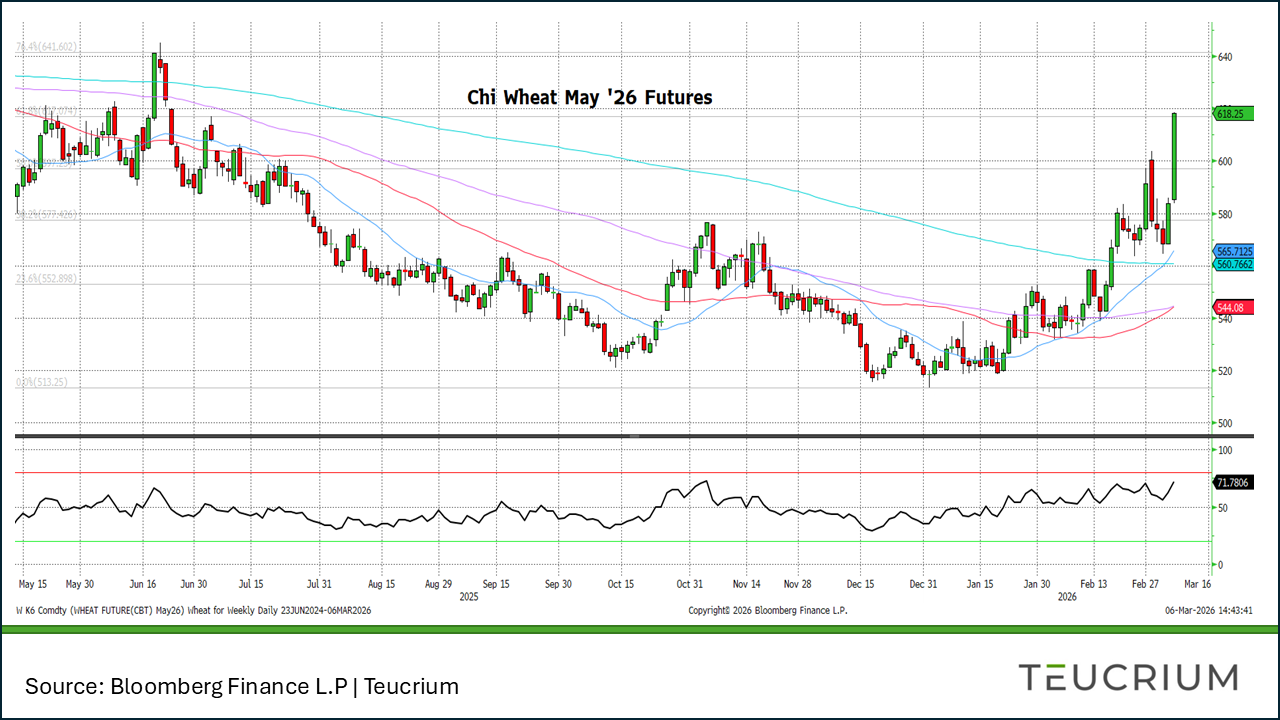
Wheat had its best week in nearly two years. Chicago May futures touched their highest level since early 2025, surging as much as 5.1% on Friday alone as geopolitical risk and technical momentum fed on each other. Funds that had been sitting comfortably short wheat spent the week covering, and fresh speculative longs piled in behind them.
The driver is the Strait of Hormuz, not the crop report. Tanker traffic through the strait dropped roughly 90% after the joint U.S.-Israel strikes on Iran, according to ship tracker MarineTraffic. That rattled global food security sentiment in a way USDA projections rarely do. Dryness in the U.S. Plains and the prospect of lower planted wheat acres globally added kindling, but the fire started in the Persian Gulf.
The FAO put it plainly: global wheat production is expected to decline to 810 million tons in 2026 as lower prices curb plantings in Russia, the EU, and the U.S. StatsCan's acreage forecast, released Thursday, has Canadian all-wheat plantings falling to 26.738 million acres from 27.031 million in 2025. The supply picture was already tightening before the war became front-page news.
Key Levels: Watch for resistance $6.40. Support perhaps around $5.76.is the level to watch on a potential pullback.
Corn
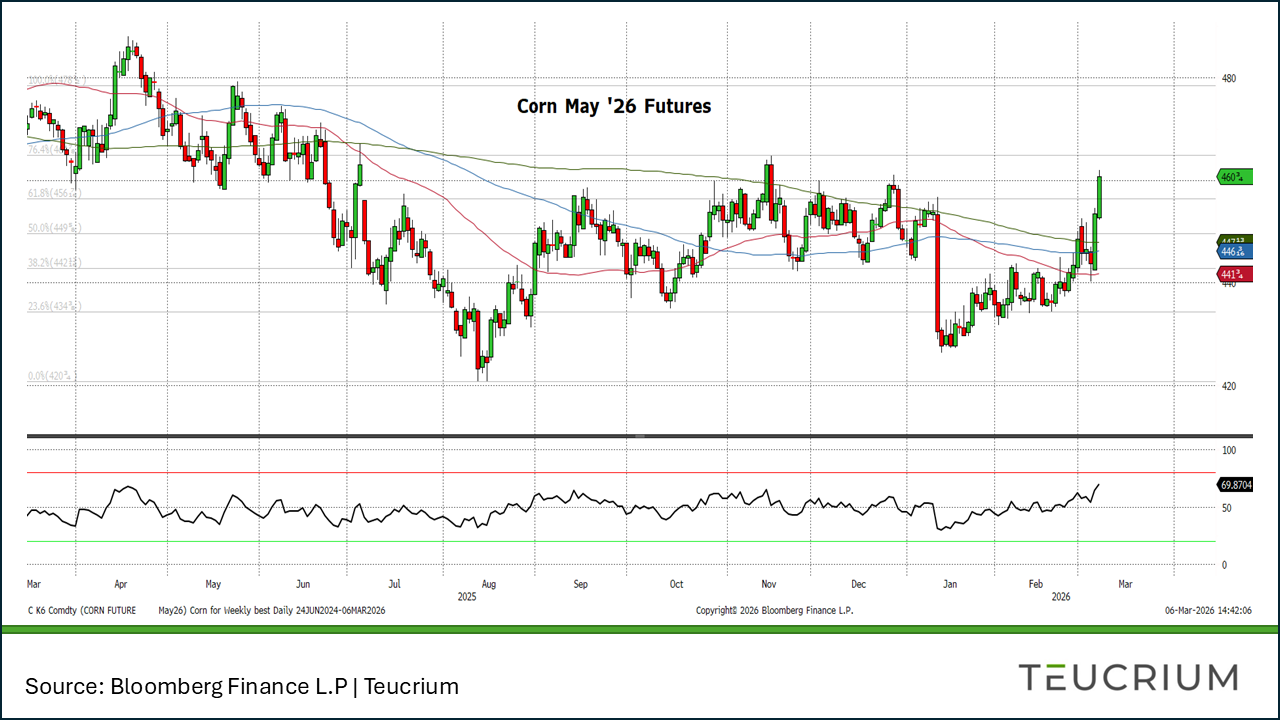
Corn clawed back into territory it hasn't held since November. May futures hit a seven-week high Thursday as export demand, rising crude oil prices, and speculative buying ran the short-covering trade well past what most desks expected. U.S. corn export sales for the week ended February 26 came in at 2.18 million metric tons across both marketing years, beating analyst forecasts.
The bigger story is what happens to acres. The Strait of Hormuz carries roughly 30% of global fertilizer trade, with around 3 million tons of ammonia and urea moving through the chokepoint each month. Urea prices in the U.S. reportedly jumped 17% in a single session early in the week. Pro Farmer's Bill Watts and Hillari Mason put it directly: the fertilizer spike is "enough to shift some acres previously intended for corn to soybeans as producers pencil out break-even costs."
USDA's Outlook Forum had already projected corn plantings at 94.0 million acres, down from 98.8 million in 2025. The soybean-to-corn insurance price ratio sits at a historically average 2.4 this spring, with corn's reference price set at $4.62 and soybeans at $11.09. Many producers in Iowa and northern Illinois applied anhydrous last fall, which locks in some corn acres regardless of what fertilizer does from here. But rotation pressure and strained cash flows are pulling in the other direction.
Watch for how producers respond in the March 31 Prospective Plantings report. That's where this fertilizer shock either shows up in the numbers or doesn't.
Key Levels: Resistance around $4.64, then $4.70 1/4. Support around $4.50.
Soybeans
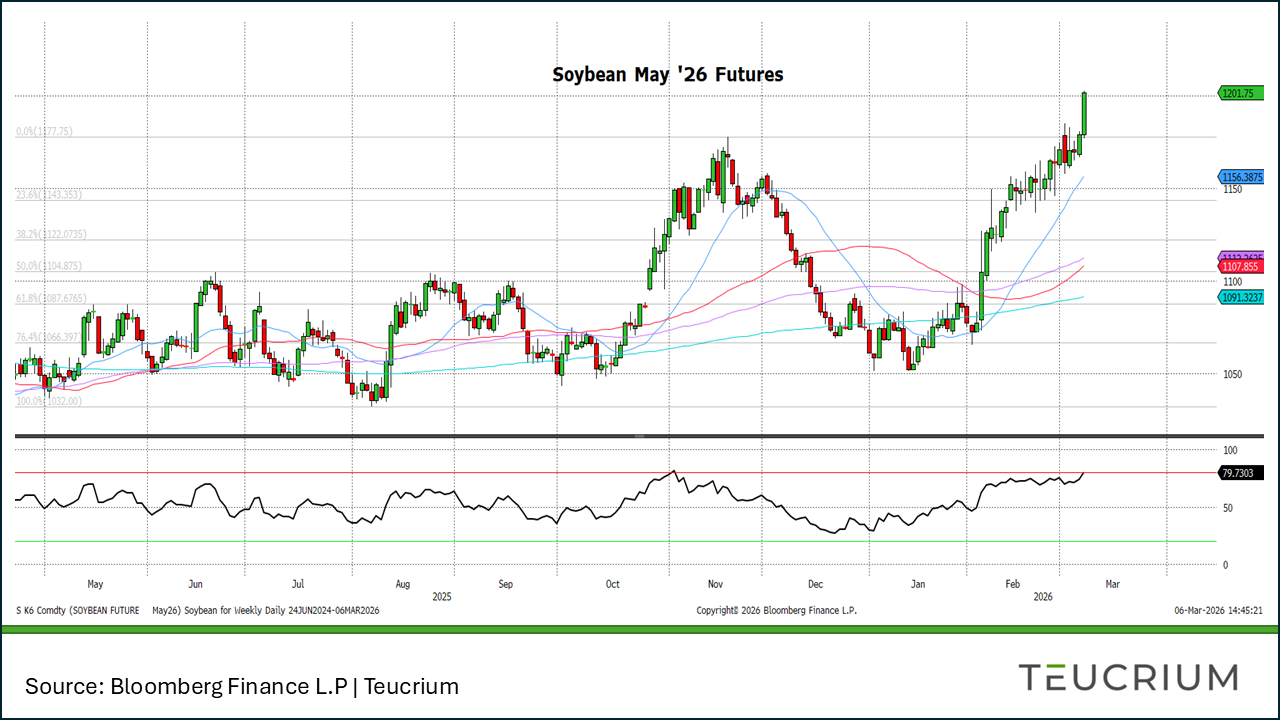
Soybeans marched higher for the second consecutive week, with the May contract touching $1,201.75 by Friday and the RSI pushing into overbought territory above 79. Soybean oil drove much of the move, climbing for a ninth straight session as Brent crude surged past $90 a barrel. When oil rallies, biofuel demand follows, and soyoil's premium role in that trade has been well bid.
The fundamental backdrop is more complicated. Agroconsult raised its Brazilian production forecast to 183.1 million tons for the 2025-26 season, up from 182.2 million in January. Pro Farmer consultant Michael Cordonnier pegs the Brazilian crop at 178 MMT with a neutral-to-lower bias, noting the harvest is running at the slowest pace in five years, with only 39% complete versus 50% at this time last year. Big crop, slow harvest. The market has mostly chosen to focus on demand.
China remains the variable that matters most. U.S. and Chinese trade negotiators are set to meet in mid-March, with soybean purchase commitments reportedly among the items on the table. If that meeting produces results, the rally could extend. If it doesn't, then the market has priced in a lot of goodwill that hasn't yet been confirmed by bookings. USDA's March 10 WASDE is the next hard data point; South American production estimates will be the line item to watch.
Key Levels: Resistance may show up around 1220. We’re watching for support at 1177.75, then around 1144.
Sugar
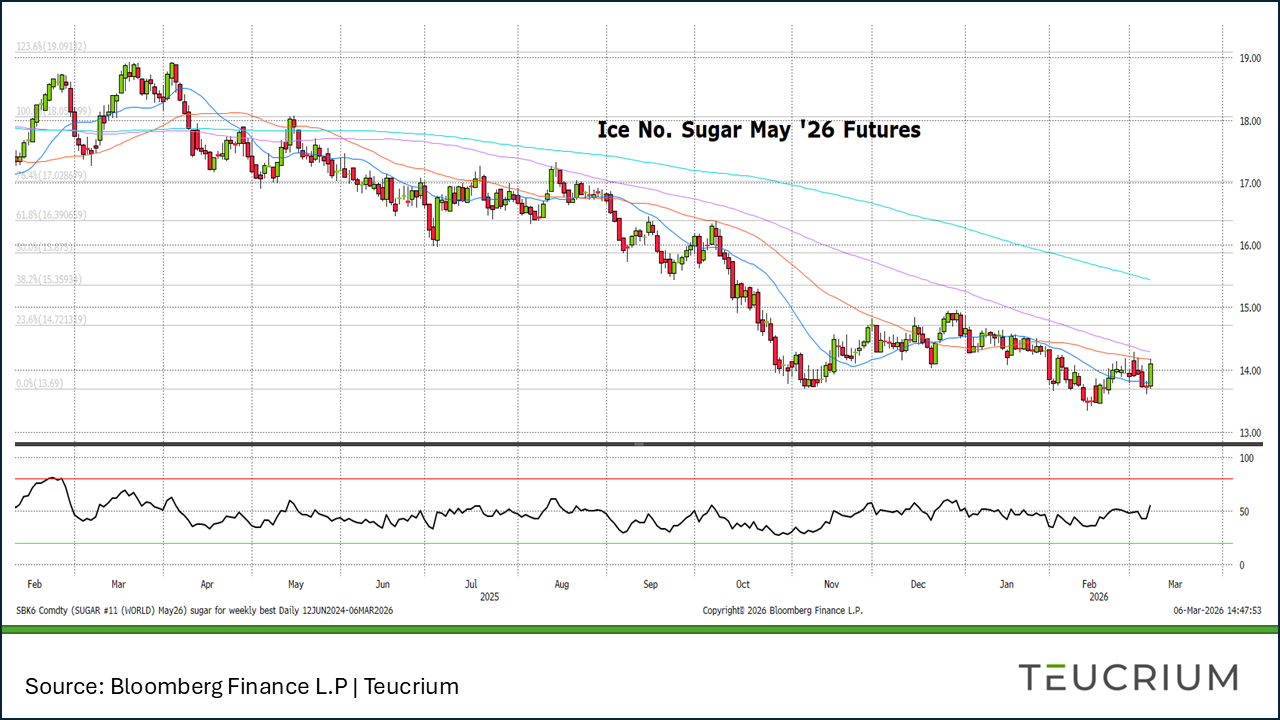
Sugar is caught between two forces and can't decide which one to follow. ICE No. 11 May futures have been grinding along the $13.50-$14.00 range for weeks, unable to find a sustained catalyst in either direction.
The bears have the better fundamental argument. Citi Research said they're "not seeing a great catalyst to drive prices upward," given production levels in Brazil and India. Sugar fell 4.1% in February, according to the UN FAO. Money managers cut their net-long white sugar positions to 14,030 contracts, the least bullish in more than eight months, per ICE Futures Europe data.
The potential bull case runs through oil. Rabobank's Charles Hart noted that sustained higher crude prices could push Brazilian cane mills to favor ethanol production over sugar, tightening global supply. With Brent above $90, that scenario is no longer theoretical. The question is whether the oil rally holds long enough to actually shift Brazilian milling ratios, or whether supply from India and Thailand keeps any upward move contained.
For now, the chart is telling the same story it's been telling since September: a steady grind lower, with the RSI just beginning to tick up from near-oversold levels.
Key Levels: Resistance near 1432 and up to 1470. Support at the recent lows near 13.69.