Counting is hard. If anyone knows this to be true, it’s the USDA.
They know it so well, that they go to great lengths to closely monitor their wording.
For example, when publishing numbers for the new crop balance sheet they refer to their figures as “projections.”
Likewise when reporting on the previous year’s balance sheet they report the numbers as “estimates.”
Projections and estimates are of course always subject to change, and they change frequently.
Understand that in the case of corn the accounting task is enormous. We’re talking ~ 17 billion bushels of production. That’s 2.5 trillion ears of corn. For context, using the average ear length of 7.5 inches, stacked vertically, that’s enough corn to extend somewhere between Mars and Jupiter.
That’s a lot of corn to keep track of.
Of course, the USDA isn’t alone in trying to account for the nation’s corn supply. Private analysts are in the game as well. And for good reason: there are hundreds of billions of dollars on the line.
Importantly, whereas the USDA publishes projections and estimates, the best term we can think of for the pre-report analyst figure is a “guess.”
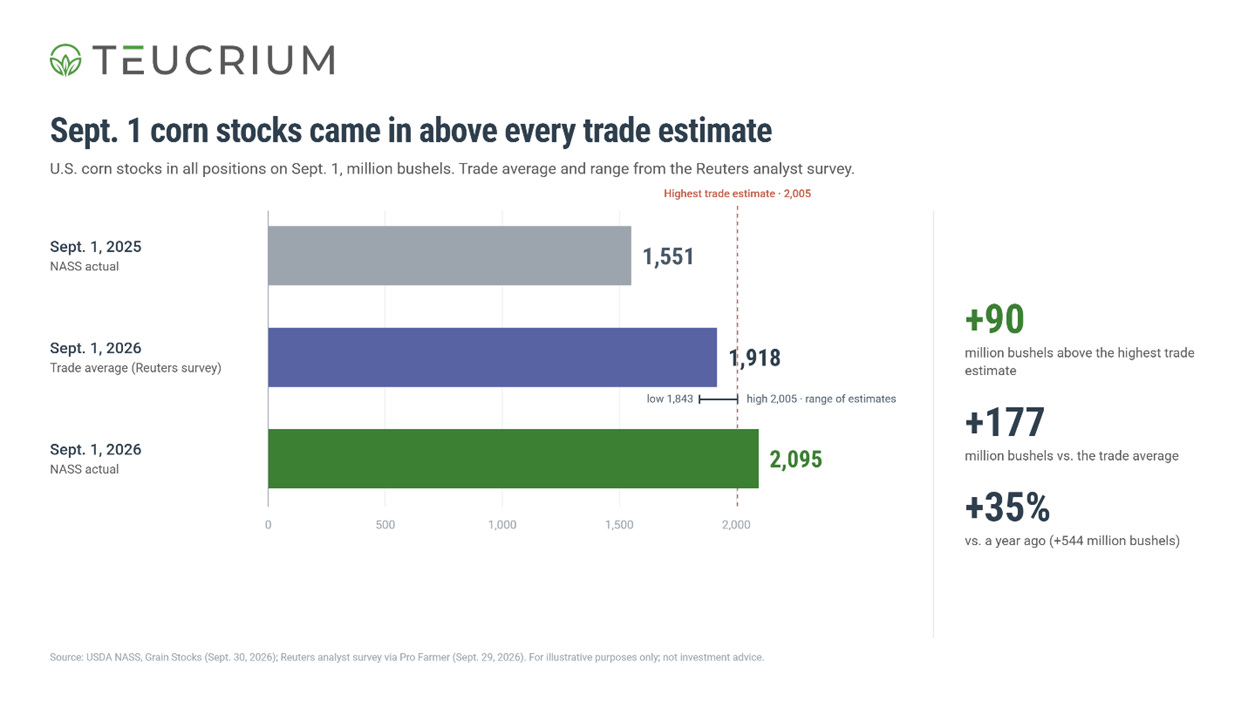
Heading into the quarterly grain stocks report on Wednesday, September 30, every analyst in the Reuters survey guessed too low.
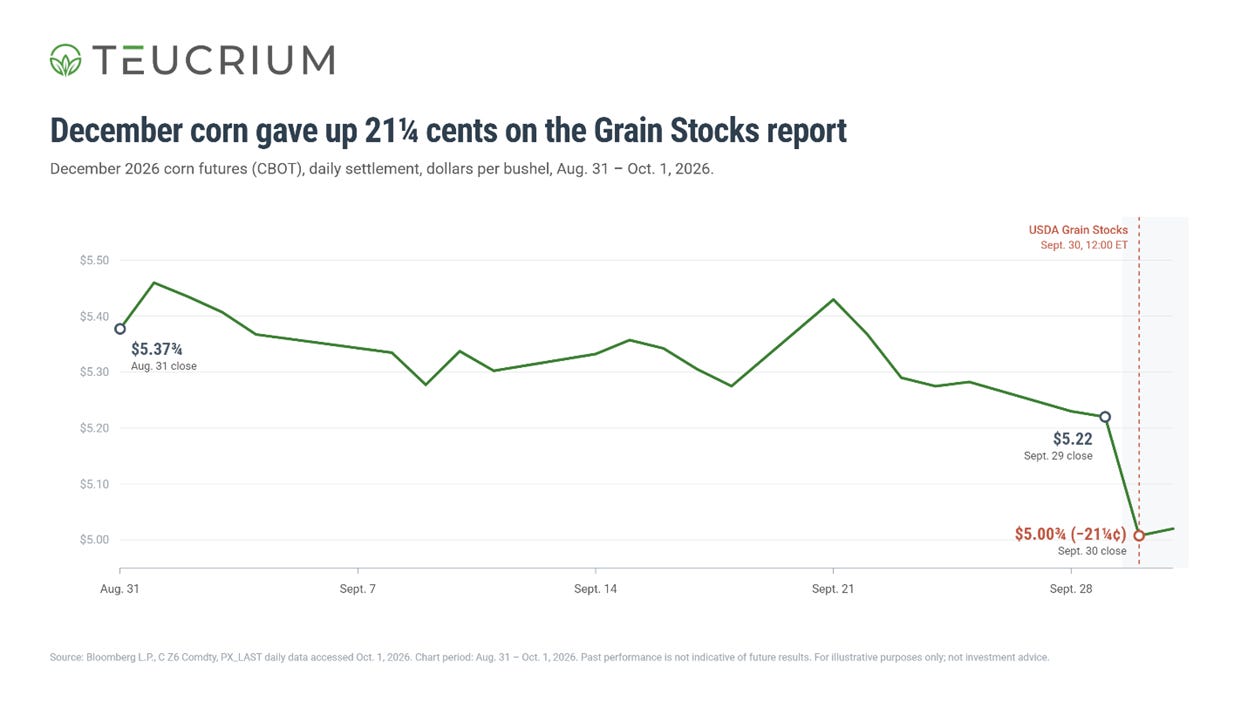
On Wednesday, USDA counted more corn in the bins than even the highest estimate, and December corn futures dropped 21 1/4 cents to settle at $5.00 3/4 per bushel. That’s a 4% 1-day loss and a 5-week low.1
NASS’s count came in 173 million bushels above USDA’s own September estimate. Even when dealing with roughly 17 billion in production, 173 million bushels is a significant number.
However, the 173 million bushel miss isn’t the full story.
Underneath it sits a bigger number: according to the USDA’s own math, there is another 57-million-bushel adjustment that points to weaker than expected demand. In total, approximately 230 million bushels of estimated demand never showed up.
That’s 177 million bushels above the average. It’s 90 million above the single most bearish guess in the survey.
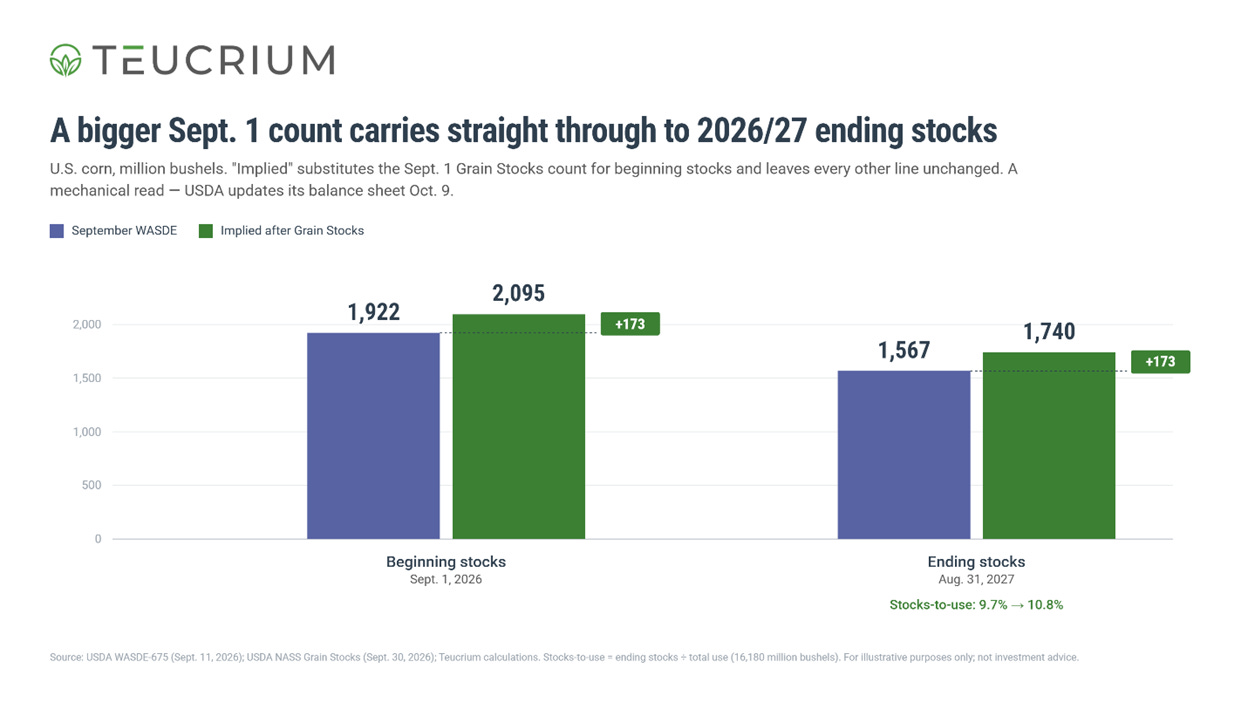
According to the USDA’s September 11 World Agricultural Supply and Demand Estimates report (WASDE) 2025/26 corn ending stocks were projected at 1.922 billion bushels. That figure came from total supply of 18.602 billion and total use of 16.680 billion.4
Less than 3 weeks later, NASS published their count which was 173 million higher versus the WASDE number.
Then came the second piece. In the same report, NASS also finished its annual review of the 2025 crop and trimmed last year’s production by 57 million bushels to 16.964 billion.5
The crop was 57 million bushels smaller than USDA thought, and the bins held 173 million more. The only way both are true is if the country used 230 million fewer bushels of corn last year than USDA’s September balance sheet showed.
So where did the demand go? Exports (3.425 billion) and food, seed and industrial use (6.905 billion, most of it ethanol) get tracked through shipping data and plant surveys, and NASS left both lines alone.
That leaves feed and residual, the line that counts what livestock ate plus every bushel the other lines miss. This figure is colloquially referred to as the “Feed and Fudge” category given its catch-all nature.
The USDA doesn’t measure it directly. It’s what’s left after everything else is counted. This time it caught the whole 230 million bushel hit.6 That’s 3.6% of USDA’s entire feed and residual line, erased in a single report.
On that math, implied total use for last year’s crop (aka old crop) falls to 16.45 billion bushels. Stocks-to-use, inventory measured against a year of demand, rises to 12.7% from the 11.5% USDA had in September.
On the September WASDE, the USDA cut the 2026 corn yield 2.2 bushels to 178.5 per acre and put production at 15.8 billion bushels on 88.5 million harvested acres.
Ending stocks were 1.567 billion bushels, a 9.7% stocks-to-use ratio.7
Wednesday’s stocks report changes all of that.
September 1 stocks are, by definition, 2026/27 beginning stocks, so the extra 173 million bushels add directly to new-crop supply. With every other line unchanged from September, we would expect ending stocks to come to roughly 1.740 billion bushels, a 10.8% stocks-to-use ratio.8
The big open question is how USDA handles the 230 million bushels on the October WASDE. It could treat them as a 1-year accounting quirk. Or it could read them as a sign that livestock are eating less corn than current models assume. USDA’s 2026/27 feed and residual estimate already took a 150-million-bushel cut in September, alongside the smaller crop.9
If USDA reads the old-crop shortfall as lower livestock demand, we think it may trim the new-crop feed line too, which would raise the implied carryout above 1.74 billion.
That was a sizeable bullish position and as the saying goes, “the bull needs to be fed.” Feeding the bull means delivering fresh bullish news. This stocks report did the opposite. Corn fell 4% in 1 day, indicating that there was a significant amount of long liquidation on a bearish report.
The CFTC’s next release, on Friday, October 2, covers positions through September 29, the day before the report so we will have to wait another week before getting the first data on positions in the wake of the report.
On December corn, watch $5.00. The contract closed below it on Friday.11 If the market can get back above $5.00 early next week that would suggest that there is still support at current levels. However, stying below $5.00 would suggest to use that the trade is treating the bigger carryout as the base case. Watch for whether the contract gets back above $5.00 before the October 9 WASDE.
We know that the USDA will use the 2.095 billion bushels as the beginning stocks number on the next WASDE reflecting projections for the 2026 – 2027 crop year.
How will the USDA handle the feed and residual category?
What will be the bottom line ending stock number published in the October WASDE?
How will the market respond?
At this juncture it is fair to say that it is anyone’s guess.