


USDA cut its corn yield estimate 1.6 bushels to 179.6 bushels per acre, which took 141 million bushels out of the crop and 91 million out of ending stocks. Analysts had expected a cut of 0.6 bushels. Soybean ending stocks fell 15 million bushels to 300 million because USDA raised exports more than it raised the crop, and they now equal 6.5% of annual use. The U.S. wheat balance sheet changed by 3 million bushels, while world wheat ending stocks rose 4.8 million tons on larger crops in Argentina, Australia, Kazakhstan and Ukraine.
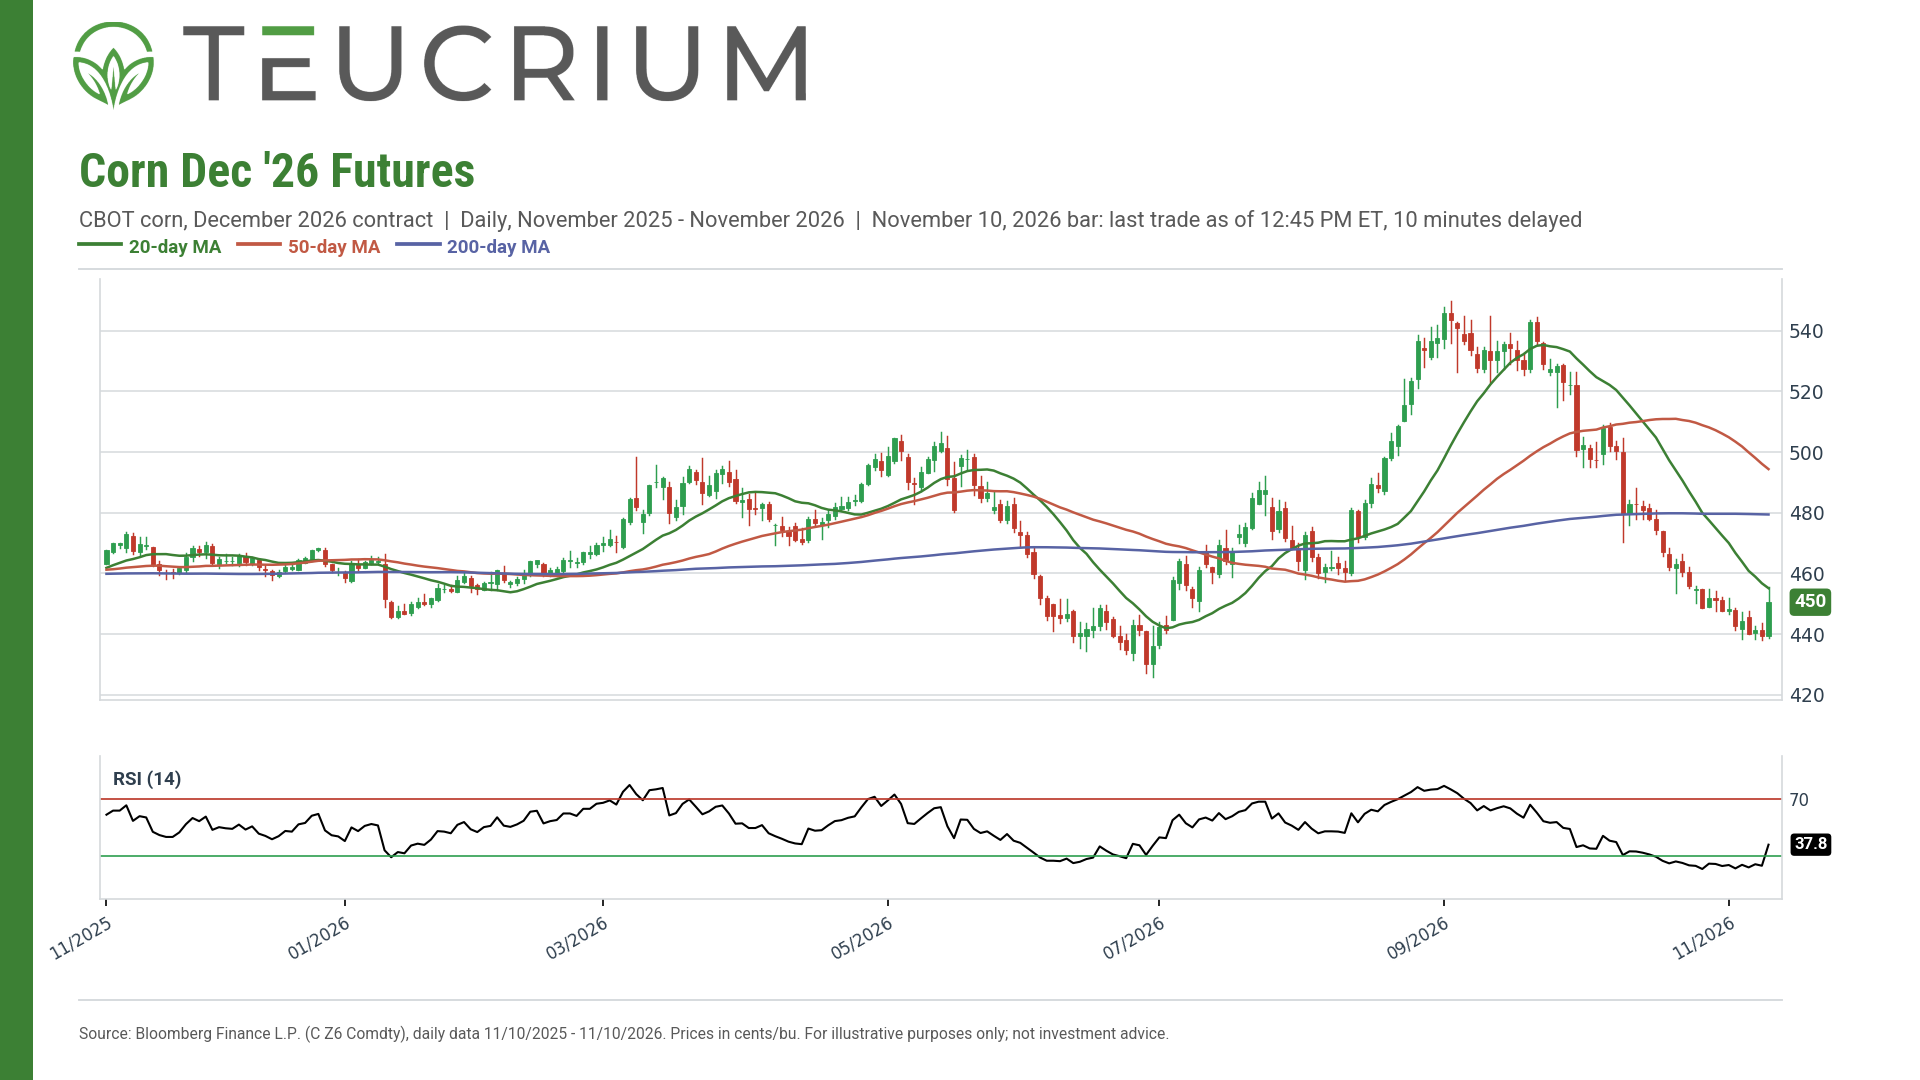
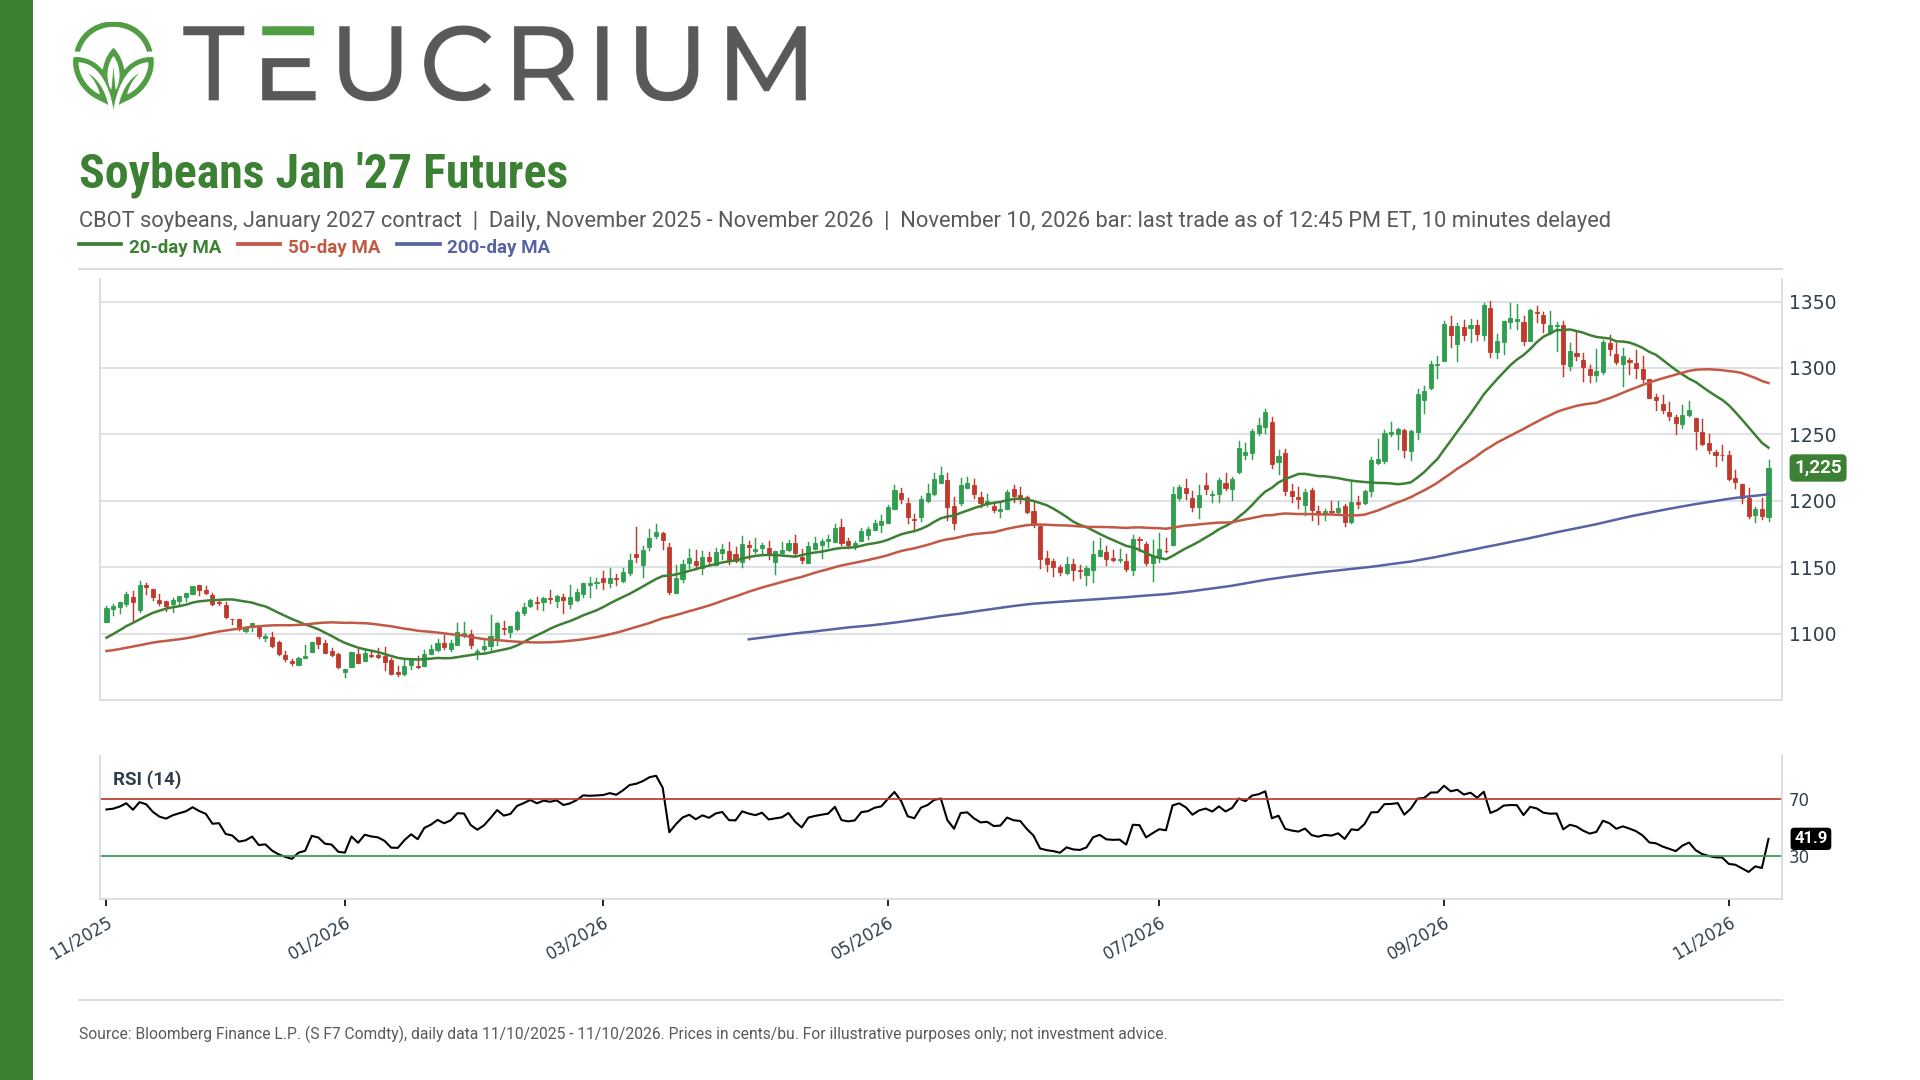
In our view grains remain in Stage #1. U.S. corn ending stocks of 1,758 million bushels still equal 10.8% of annual use, above the 9.7% USDA projected in September, and USDA lowered its corn price forecast $0.10 to $4.60 in the same report that cut the crop. Even so, we read the report as neutral to bullish for corn and soybeans, and the price charts point the same way. On the daily charts, corn and soybean futures both broke above trendline resistance, which suggests the harvest lows are in. That breakout could start a new trend, and in our view it'll have an upward bias.
The events that could move prices out of Stage #1 remain outside the U.S. balance sheets: the Black Sea conflict, where USDA cut Russian and Ukrainian wheat exports again, and South American planting, where USDA raised the corn crops in Argentina and Brazil 2.0 million tons each. The next update to the U.S. corn and soybean crop estimates comes January 12, when USDA publishes final production. The December 10 report can change use and trade.
CORN
NASS cut the corn yield 1.6 bushels to 179.6 bushels per acre, 1.0 below the 180.6 average of analysts surveyed by Bloomberg, the financial news and data company, and inside the survey range of 173.2 to 183.1. Harvested area held at 88.5 million acres. Production fell 141 million bushels to 15,893 million, 87 million below the analyst average. It would still be the second-largest U.S. corn crop on record behind last year's 16,964 million.
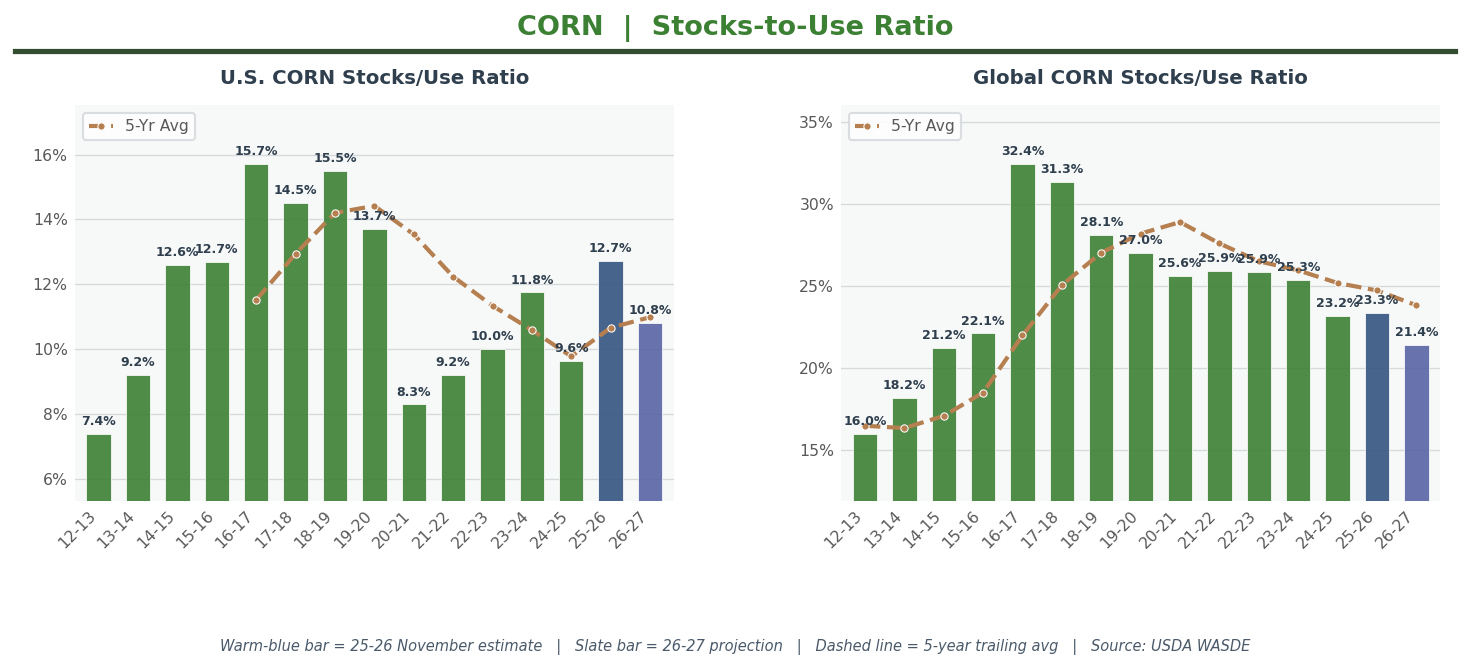
The smaller crop caused the drop in ending stocks. Beginning stocks held at 2,095 million bushels, so total supply fell by the same 141 million as the crop, to 18,013 million. USDA lowered two uses: feed and residual by 25 million bushels to 5,975 million because the crop is smaller, and exports by 25 million to 3,275 million on shipments and sales to date. Ethanol held at 5,650 million. Total use fell 50 million to 16,255 million, so ending stocks fell 91 million to 1,758 million, 88 below the analyst average and inside the 1,698 to 1,969 range of analyst estimates. New-crop ending stocks now equal 10.8% of annual use, down from 11.3% in October and above the 9.7% in September.
USDA lowered the 2026/27 season-average corn price forecast $0.10 to $4.60 per bushel, the second straight $0.10 cut.
USDA left the 2025/26 (old-crop) balance sheet nearly unchanged. Feed and residual use fell 1 million bushels to 6,118 million and ethanol rose 1 million to 5,548 million. Ending stocks stayed at 2,095 million, 12.7% of annual use, and the season-average price forecast stayed at $4.16.
World 2026/27 corn ending stocks rose 1.5 million tons to 281.94 million, above the 281.2 analyst average. Stocks outside the United States rose 3.8 million tons, which more than offset the 2.3 million ton drop in U.S. stocks. USDA raised Argentina's crop 2.0 million tons to 57.0 million on planting progress that points to more area, and Brazil's crop 2.0 million to 141.0 million on larger first-crop area. Analysts had expected 55.3 million for Argentina and 139.6 million for Brazil. USDA cut Ukraine's corn exports 2.0 million tons to 20.0 million, which left that corn in Ukraine's ending stocks, and cut China's feed use 2.0 million tons. It lowered production in South Africa by 1.5 million tons and in Mexico and the EU by 0.5 million each. World new-crop ending stocks equal 21.4% of annual use, up from 21.2%. Even with that increase, world stocks-to-use is near its lowest level in a decade. Tight world stocks and a smaller U.S. crop support corn prices, and in our view they could tilt the risk toward higher prices.
SOYBEANS
Higher exports caused the drop in soybean ending stocks. USDA raised the yield 0.2 to 53.3 bushels per acre with harvested area unchanged at 85.9 million, putting production at 4,574 million bushels, up 12 million. Analysts had expected 53.5 bushels and 4,596 million. USDA said higher yields in Minnesota, Iowa, South Dakota and Nebraska accounted for most of the increase, partly offset by lower production in Illinois, Kansas, Missouri and Arkansas.
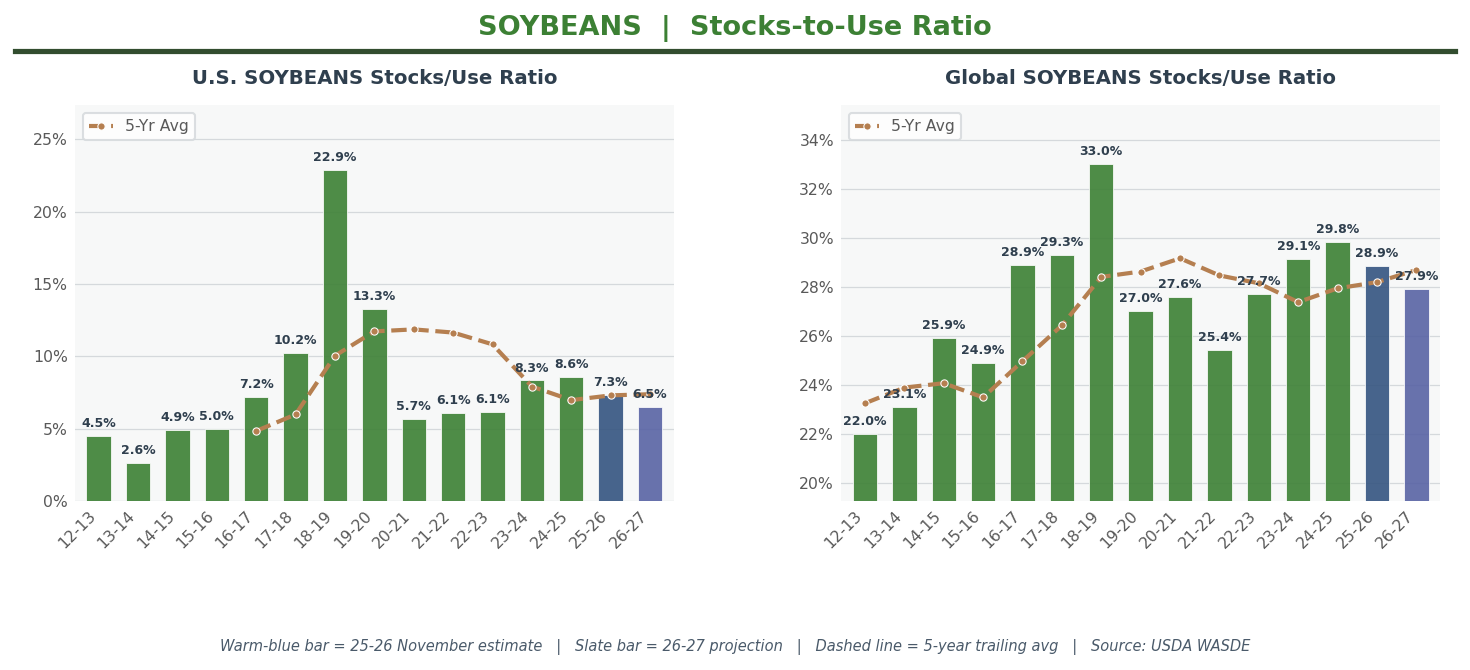
Beginning stocks held at 315 million bushels, so total supply rose 12 million to 4,914 million. USDA raised exports 25 million to 1,720 million on larger supplies and the early-season export pace, raised seed use 3 million to 76 million and held crush at a record 2,780 million. Total use rose 27 million to 4,614 million. Ending stocks fell 15 million to 300 million, 32 below the 332 million analyst average and inside the 280 to 404 range. Analysts had expected ending stocks to rise, so the export increase gave soybean bulls something to chew on. New-crop ending stocks now equal 6.5% of annual use, down from 6.9% in October, which is low compared with past years.
USDA raised the 2026/27 season-average soybean price forecast $0.10 to $12.10 per bushel. It held soybean meal at $340 per short ton and lowered soybean oil 2 cents to 68 cents per pound.
USDA left the 2025/26 (old-crop) soybean balance sheet unchanged, with ending stocks at 315 million bushels, 7.3% of annual use, and the price forecast at $10.50. USDA lowered 2025/26 soybean oil production 139 million pounds to 30,576 million and raised biofuel use 100 million to 14,900 million, so 2025/26 oil ending stocks fell 199 million pounds to 1,458 million. With that lower starting inventory and a 100 million pound cut to food and other use, 2026/27 oil ending stocks fell 99 million pounds to 1,698 million. USDA cut 2025/26 soybean meal ending stocks 117,000 short tons to 333,000 and 2026/27 meal ending stocks 50,000 to 400,000.
World 2026/27 soybean ending stocks fell 0.8 million tons to 123.50 million, 1.3 million below the 124.8 analyst average, mostly on lower stocks in the United States and Argentina. World production slipped 0.2 million tons to 442.5 million, with cuts for Ukraine, South Africa, the EU and Mexico partly offset by increases for the United States and Colombia. USDA held Brazil's crop at 186.0 million tons and Argentina's at 50.0 million, both in line with the analyst averages. World new-crop ending stocks equal 27.9% of annual use, down from 28.1%.
WHEAT
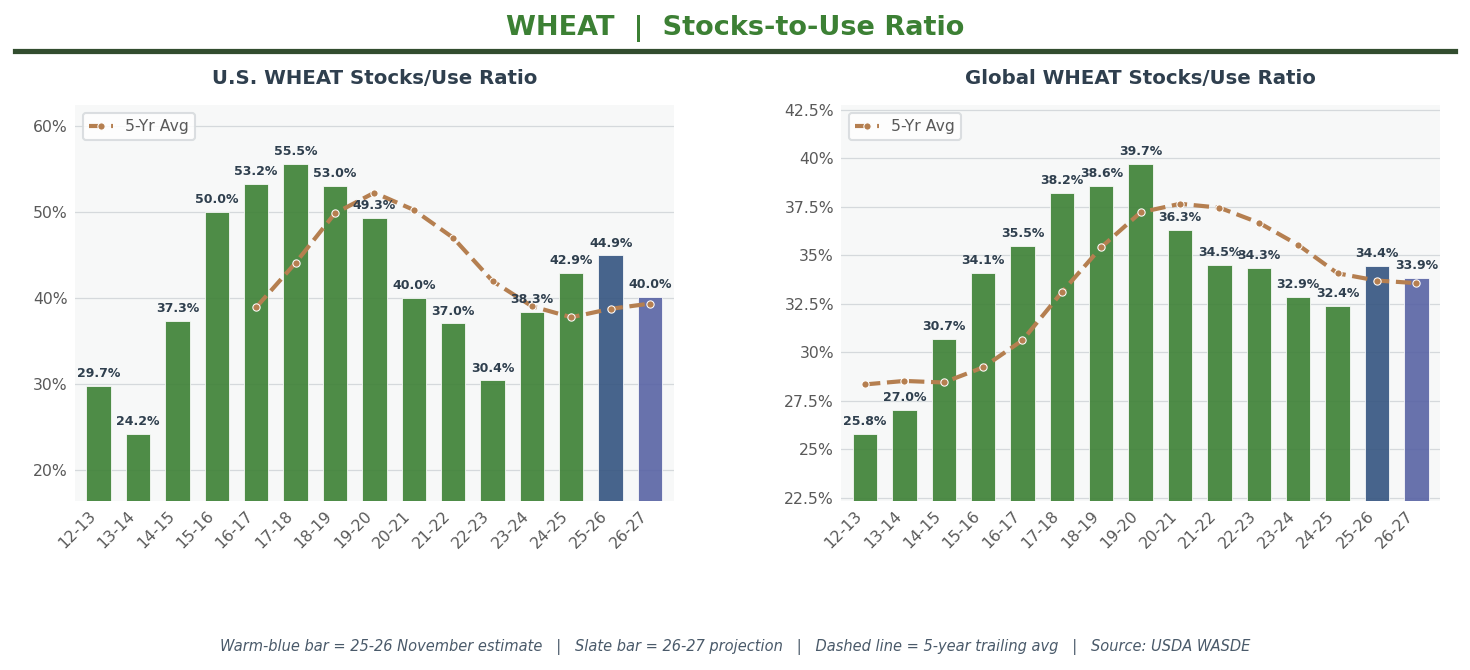
Lower food use projections lead to an increase in U.S. wheat ending stocks in the amount of 3 million bushels. USDA held supply at 2,599 million bushels and exports at 750 million. It lowered food use 3 million to 957 million after the NASS Flour Milling Products report showed 2% less wheat ground for flour in July through September than a year earlier. Ending stocks rose to 743 million, 1 below the 744 million analyst average and 19% below last year. Ending stocks now equal 40.0% of annual use, up from 39.8%.
Within the unchanged export total, USDA moved 10 million bushels from Hard Red Winter to White wheat. Hard Red Winter exports fell to 165 million bushels on weak sales and shipments. USDA's words: "HRW exports are now the second lowest on record." White wheat exports rose to 235 million because White wheat is priced competitively against other exporters into Asia.
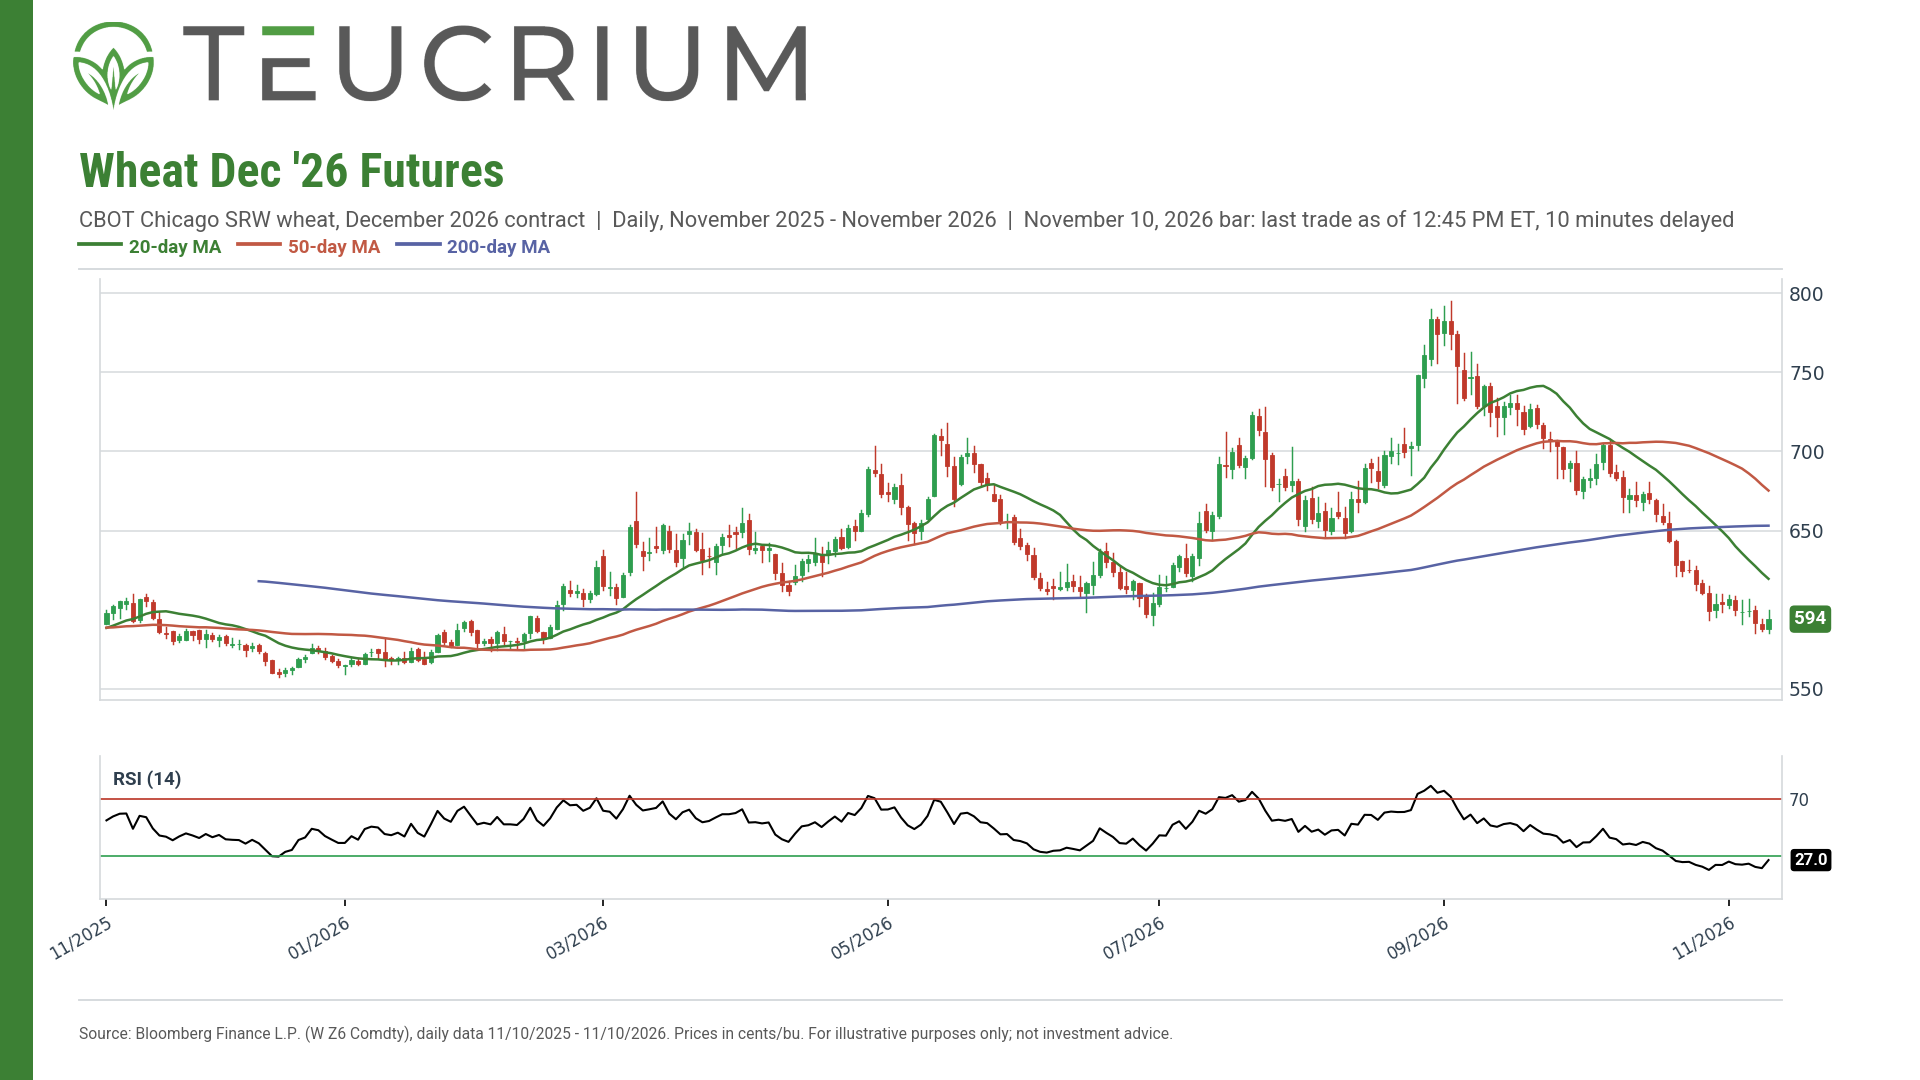
USDA lowered the 2026/27 season-average farm price forecast $0.10 to $6.20 per bushel, the second straight $0.10 cut, on prices reported to date and its expectations for futures and cash prices over the rest of the marketing year.
Larger crops in Argentina, Australia, Kazakhstan and Ukraine raised world wheat ending stocks. Global supplies rose 6.4 million tons to 1,110.4 million. USDA raised Argentina 1.5 million tons to 23.0 million and Australia 1.5 million to 32.5 million as both countries start harvest in favorable conditions, Kazakhstan 0.8 million to 15.8 million and Ukraine 0.5 million to 26.5 million. Consumption rose 1.7 million tons to 829.6 million, mostly on feed use in Australia, Kazakhstan and Ukraine. World trade fell 0.3 million tons to 208.7 million. USDA cut Russia's exports 1.0 million tons to 39.0 million and Ukraine's 1.0 million to 11.5 million because the Black Sea conflict keeps shipments from both countries below their long-term averages, and it raised exports from Australia and Argentina. USDA has now lowered Russia's export forecast 4.0 million tons in 2 months. World ending stocks rose 4.8 million tons to 280.82 million, above the 280.0 million top of the analyst range, and equal 33.9% of annual use, up from 33.3%.
Past performance is not indicative of future results. This commentary is for informational purposes only and does not constitute investment advice. Commodity investments involve substantial risk of loss.
