

The March WASDE landed with a thud. USDA delivered a status quo report that offered little ammunition for bulls across the grain complex. We remain firmly in Golden Grain Cycle Stage #1, where prices continue chopping sideways around cost-of-production levels. The few surprises that did emerge cut both ways: global corn stocks came in heavier than expected, while global soybean supplies landed roughly in line with forecasts. Weather remains the wild card as South American harvest progresses, and geopolitical strategic shipping routes (the Strait of Hormuz and the Black Sea) face continued geopolitical stress/uncertainty.
CORN
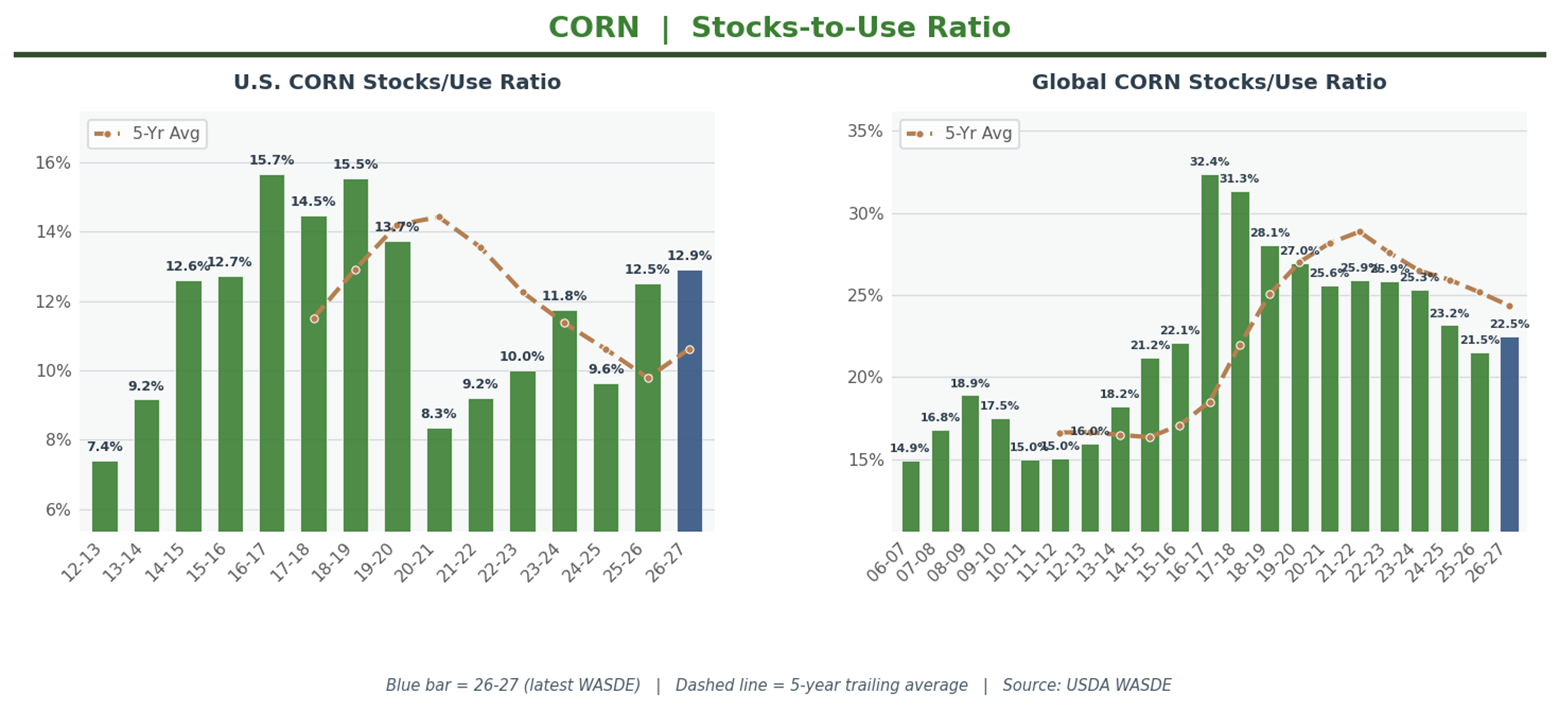
USDA left the U.S. corn balance sheet untouched this month. Ending stocks held at 2.127 billion bushels, fractionally below the 2.131 billion analysts expected. The season-average farm price stayed pinned at $4.10 per bushel.
U.S. stocks-to-use sits at 12.91%, squarely in adequate territory. Not tight enough to spark a rally, not burdensome enough to pressure prices lower. It's the definition of sideways.
The global picture leaned bearish. World ending stocks jumped to 292.8 million metric tons, up 3.8 million from last month and 3.3 million above the 289.5 million analysts projected. Global stocks-to-use at 22.50% reflects comfortable world supplies. The international trade flows that might tighten this picture remain hostage to tariff uncertainty and Black Sea logistics.
SOYBEANS
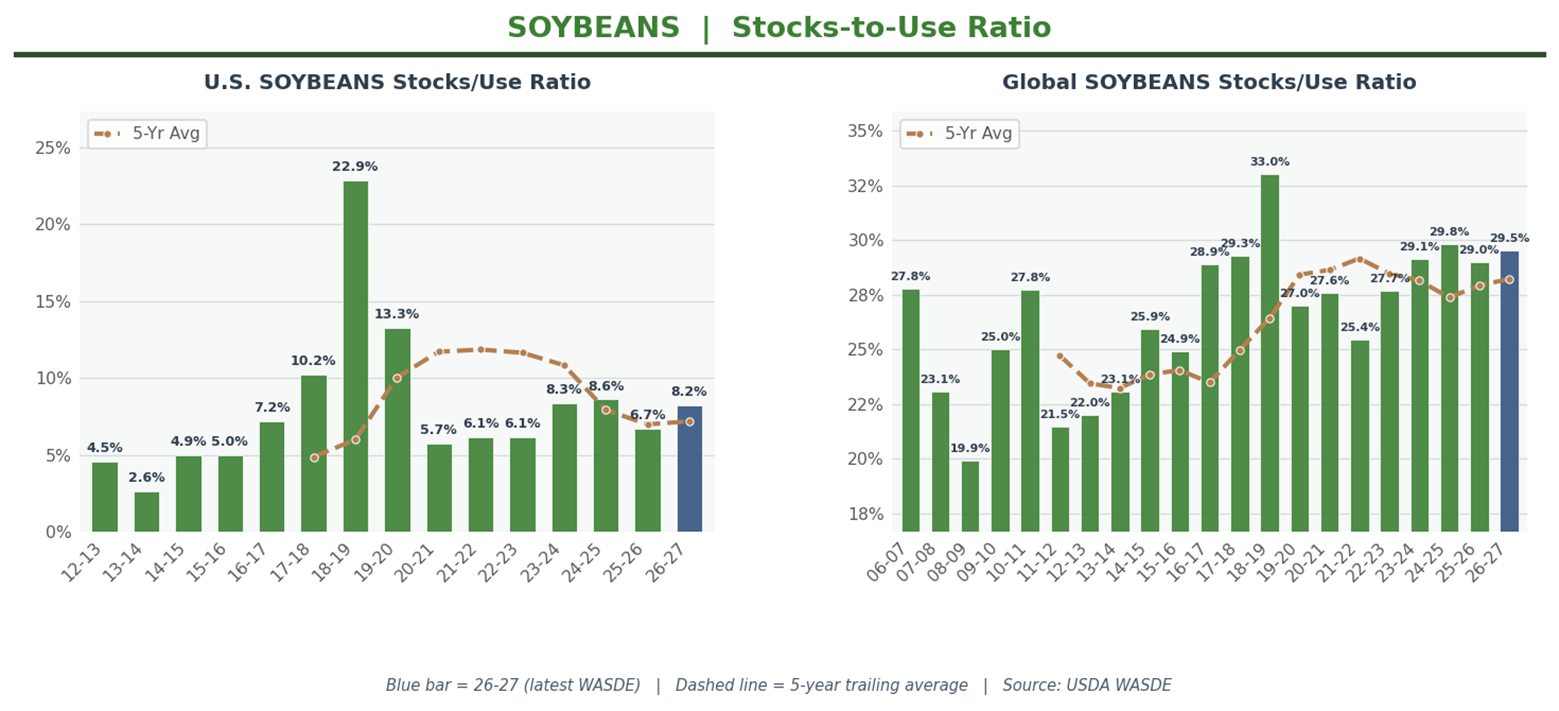
USDA made offsetting adjustments that left U.S. ending stocks unchanged at 350 million bushels, slightly above the 346 million expected. Imports rose 5 million bushels. Crush increased 5 million bushels on stronger domestic meal demand. The real story: soybean oil for biofuel got slashed 800 million pounds to 14.0 billion, a notable demand signal worth watching.
U.S. stocks-to-use at 8.21% remains tight by historical standards. This is a snug pipeline, the kind that leaves little room for error if export demand surprises or crush margins improve.
Global stocks came in roughly as expected. World ending stocks at 125.31 million metric tons landed just above the 125.0 million analysts projected, a 0.31 million metric ton beat. With supply essentially in line with forecasts, the global balance sheet offers little fresh directional signal unless South American harvest surprises or Chinese buying accelerates.
WHEAT
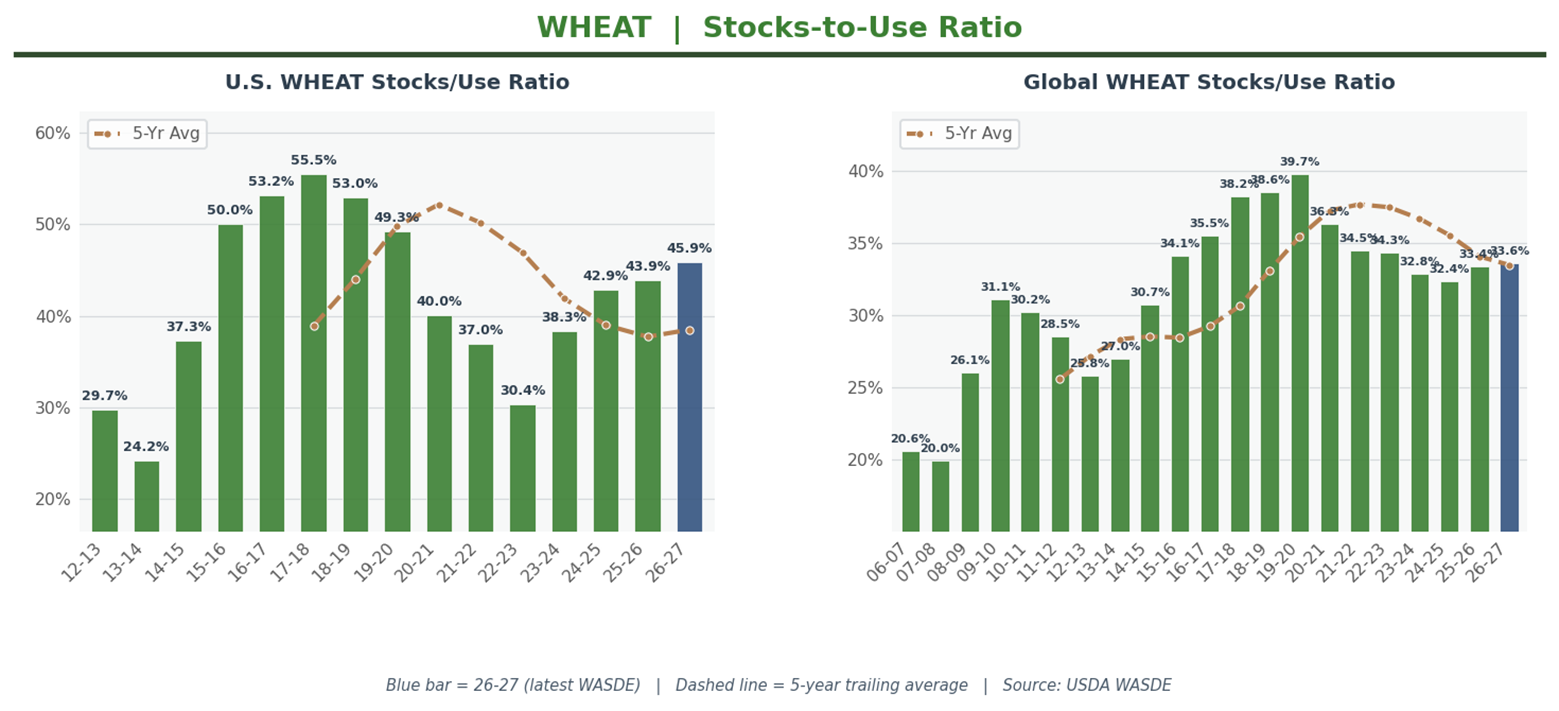
Wheat remains the bearish standout. USDA made no changes to U.S. supply or use categories, leaving ending stocks at 931 million bushels versus the 926 million expected. The only movement: a nickel bump in the season-average farm price to $4.95 per bushel.
U.S. stocks-to-use at 45.91% is burdensome by any measure. Nearly half a year's worth of supply sitting in carryout reflects ample domestic availability and continued struggles competing in export markets.
Global stocks ticked down 0.6 million metric tons to 277.0 million, marginally below the 277.5 million expected. World stocks-to-use at 33.58% sits above the 30% threshold that typically signals adequate to burdensome conditions. U.S. wheat needs an export story to change the narrative, and this report didn't provide one.
The market got what it expected: more of the same.
Topics: